

Perfect correlations and disastrous outcomes
Part 2 of 9: Statistical fallacies that cost millions

Previous: Statistical fallacies that cost millions (and how to spot them) | Next: The overfitting trap
Picture this: You're the marketing director at a trendy avocado startup (classic Silicon Valley, right?). You've been running ads on two platforms — let's call them Googol and Foceboak — and you're trying to figure out which one actually works.
After three months, you finally dive into the numbers. You calculate the correlation between ad spending and avocado sales for each platform's experimental budget. The results? Both show a perfect correlation of 1.0.
"Excellent!" you think. "Both platforms are equally effective!"
However, when you dig deeper into the actual performance:
Googol: Every $1 spent generates 100 avocado sales
Foceboak: Every $1 spent generates 10 avocado sales
How can both have perfect correlations when one platform is clearly 10x better than the other?
Welcome to the first and most dangerous statistical trap: confusing correlation with causation, and misunderstanding what correlation actually measures.

What perfect correlation really means
When most people talk about correlation, they're referring to the Pearson correlation coefficient — a number between -1 and 1 that measures the strength of a linear relationship between two variables. (For the nerds out there, the other common correlation measures are the Spearman rank correlation coefficient and Kendall rank correlation coefficient).
Here's what those numbers mean:
1: Perfect positive linear relationship
0: No linear relationship
-1: Perfect negative linear relationship

But here's the crucial part that trips up even experienced analysts: correlation measures the strength of a linear relationship, not the slope or the actual impact.
Going back to our avocado example:
Googol ads: Sales = 100 × Ad Spend (correlation = 1)
Foceboak ads: Sales = 10 × Ad Spend (correlation = 1)
Both have perfect linear relationships, but completely different business value. However, it's clear that Googol ads are better than Foceboak ads by a factor of ten! (This is a hypothetical pedagogical example, so any similarities to real-life companies and implications on their respective advertising platforms are completely coincidental).
Most of the time, we care about effect size (the slope), not just the strength of the relationship.
The linear relationship trap
The Pearson correlation coefficient has another major limitation: it only detects linear relationships.
Remember y = mx+b from your pre-algebra class? That's the most basic form of a linear relationship.
Take a look at these different patterns:
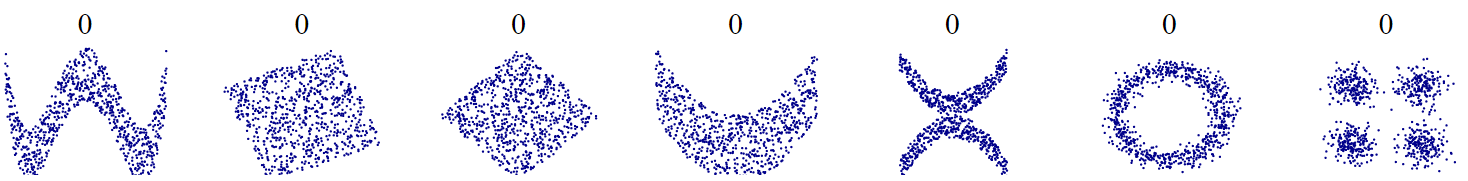
Each of these datasets shows a clear, obvious pattern. Yet because the relationships aren't linear, the Pearson correlation misses them entirely.
This means you could have a powerful, predictable relationship between two variables that correlation completely misses. Imagine missing a crucial business insight because you relied solely on correlation to detect patterns in your data.
So the fact that the Pearson correlation coefficient only applies to linear relationships is double-edged. It's nice because a linear model is very simple and understandable, but it also means that the Pearson correlation will not be able to detect more subtle relationships between variables.
The four possibilities when X and Y are correlated
When you observe a correlation between two variables, there are only four possible explanations:
X causes Y (what we usually hope for)
Y causes X (the reverse of what we expected)
A third variable causes both X and Y (the hidden factor)
Pure coincidence (it happens more than you'd think)
Consider this real example: There's a strong correlation between ice cream sales and drowning deaths. Does ice cream cause drowning? Do drownings somehow boost ice cream sales?
The hidden third variable is temperature — hot weather increases both ice cream consumption and swimming, which leads to more drownings.
Spotting correlation traps in the wild
Here are the red flags that should make you pause before drawing conclusions from correlation:
Perfect or near-perfect correlations: Real-world relationships are messy. If you see correlations above 0.9, be extra skeptical.
Correlations without plausible mechanisms: Always ask: "What would be the actual causal pathway here?" If you can't think of one, you're probably looking at coincidence.
Cherry-picked time periods: Correlations can vary dramatically across different time windows. Make sure you're not just seeing a temporary relationship.
The Tyler Vigen test
Before you base any important decision on a correlation, ask yourself: "Is this as ridiculous as the correlation between spelling bee word lengths and venomous spider deaths?"
Tyler Vigen's website is a masterclass in why correlation alone is meaningless. Some of my favorites:
The popularity of "Never Gonna Give You Up" correlates with the number of market research analysts in Wyoming1
The popularity of the name "Thomas" correlates with motor vehicle thefts in Maine
LeBron James' field goal count correlates with votes for Democratic senators in Michigan

These correlations are statistically real but obviously meaningless. The same could be true of the correlations in your data.
Using correlation responsibly
Correlation isn't entirely useless — it's actually a valuable tool when used correctly. Here's how:
Use it as a starting point, not an endpoint: Correlation can point you toward interesting relationships worth investigating further.
Always look for the mechanism: Before trusting a correlation, understand why the relationship might exist.
Test different time periods: Real relationships should be somewhat stable across different time windows.
Consider alternative explanations: What third variables might be driving both factors?
Remember: correlation measures association, not causation: This is the most important point. Just because I wear my lucky socks every time I win the lottery doesn't mean the socks cause lottery victories.

Great for discovery, not for decisions
The worst mistake you can make as a data practitioner is to calculate a correlation coefficient and immediately make decisions based on that number alone.
Correlation is a useful tool for discovery, but a terrible tool for decision-making.
Before you bet your business on a singular correlation, ask yourself:
Does the mechanism make sense?
Is the relationship stable over time?
Have I considered alternative explanations?
Am I confusing strength of relationship with actual impact?
Correlation is cheap. Understanding is expensive. Bankruptcy is pricier.
This is Part 2 of our 9-part series on statistical fallacies. Subscribe below for more:
Next time: We'll explore one of the most seductive traps in data science: overfitting. I'll show you why models that achieve perfect accuracy on your historical data are often the most dangerous ones to deploy, and how this obsession with mathematical perfection turns your models into a ticking time bomb waiting to explode in production.
Catch up on the entire series: