

Confessions under torture: how p-hacking forces data to lie
Part 4 of 9: Statistical fallacies that cost millions

Previous: The overfitting trap | Next: Base rate blindness: how 90% accurate tests can be 90% wrong
You're the portfolio manager for a major entertainment investment fund, and you need to predict next year's spending on live entertainment. Your bonus depends on getting this right — how else are you supposed to afford that orange Lamborghini of your dreams?
You decide to analyze hundreds of economic variables, searching for anything that correlates with entertainment spending. After running thousands of correlation tests, you finally strike gold: one variable shows an incredible 0.96 correlation with annual live entertainment expenditure.
"Eureka!" you think. "At this rate, I'll be able to afford the Veneno Roadster!"
There's just one tiny problem: the variable you're betting millions on is the number of Mac computers sold in Zimbabwe each year.
Welcome to the world of data snooping, where statistical significance becomes statistically meaningless.

What is data snooping?
Data snooping, also called data dredging or p-hacking, is the practice of exhaustively mining datasets to uncover statistically significant relationships. It sounds scientific and rigorous. It feels like detective work. And it's one of the most dangerous practices in modern data analysis.
Here's how it works:
Take a large dataset with many variables
Run statistical tests on every possible variable combination
Celebrate when you find "significant" correlations
Completely ignore the fact that you tested thousands of meaningless relationships
Run enough tests and false positives become inevitable. It's like buying thousands of lottery tickets and then declaring yourself a lottery genius when one of them wins.
In some ways, data snooping is the cousin of The overfitting trap and Perfect correlations and disastrous outcomes.
Where statistical tests fail
Traditional statistical tests are designed to work when you're testing a single, specific hypothesis. The standard threshold for "statistical significance" assumes you're running one test, not hundreds.
Here's the math that will haunt your dreams:
If you run 1 test with a 5% false positive rate, you have a 5% chance of a false discovery
If you run 20 tests, you have about a 64% chance of at least one false positive
If you run 100 tests, you have a 99.4% chance of false discoveries
If you run 1,000 tests, false positives become virtually certain
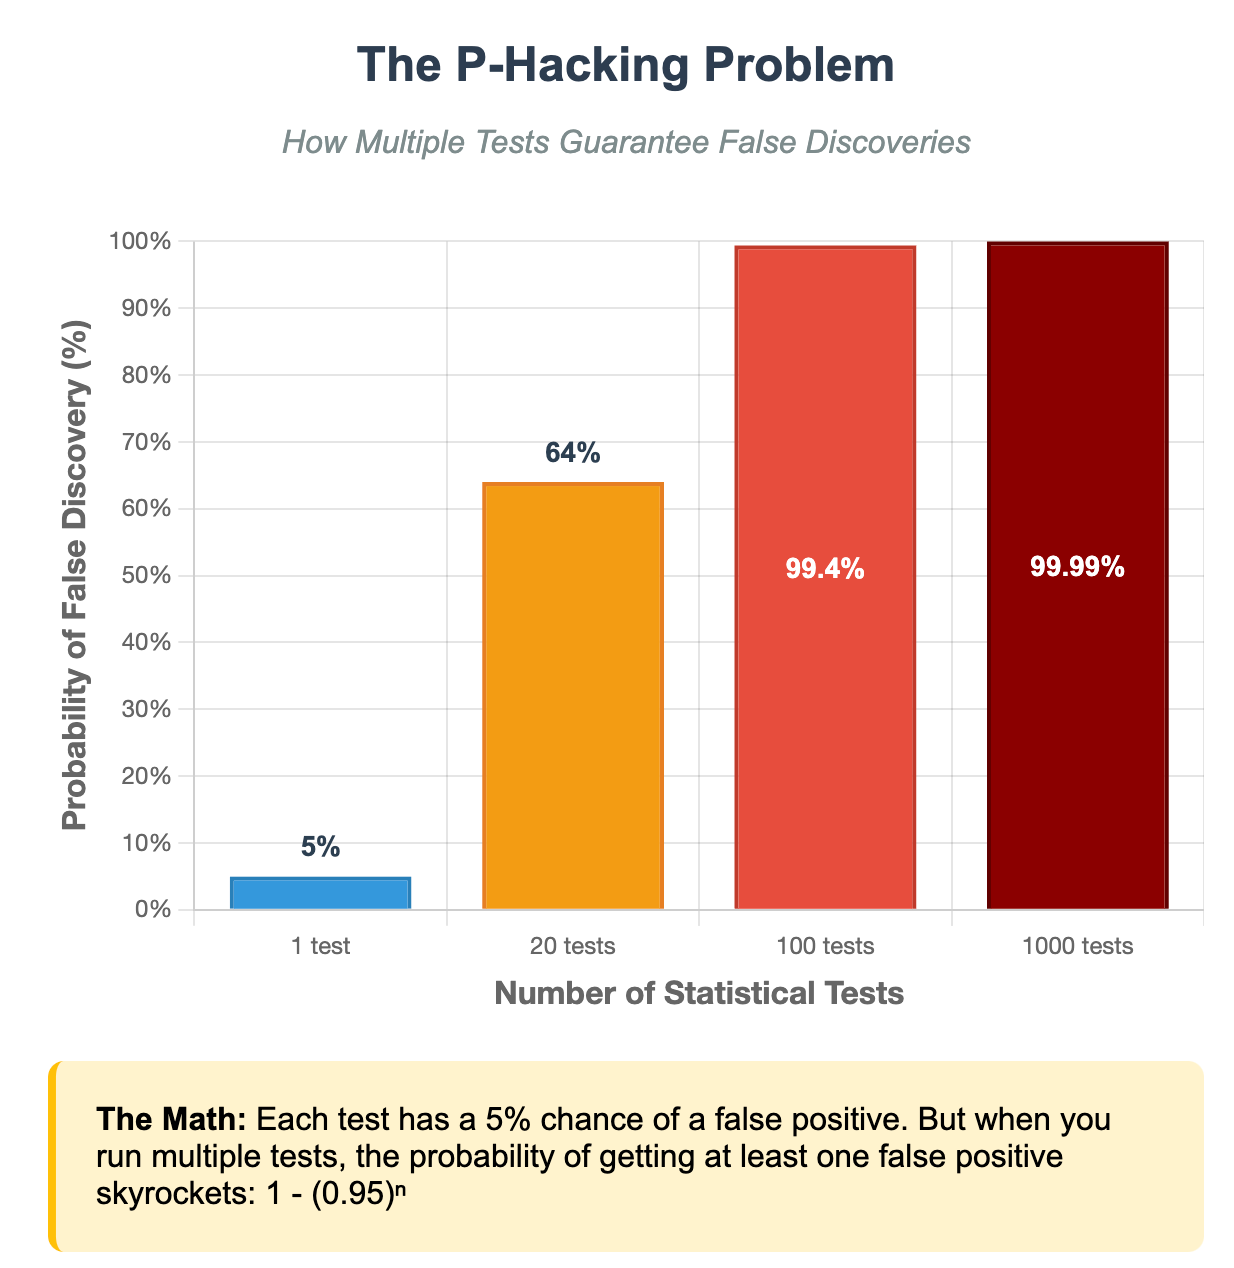
This is why data snooping is so insidious. The more thorough your analysis feels, the more likely you are to find meaningless patterns.
Counter-tests: how to test your tests
Some suggestions on how to avoid blatant p-hacking and data snooping:
Before starting: set clear boundaries
Pre-register your hypotheses: Decide what you're testing before you look at the data. Write down your specific predictions and stick to them.
Hold back validation data: Never use your full dataset for initial testing. Keep 20-30% completely separate for final validation—and don't touch it until the very end.
During analysis: control for multiple testing
Use statistical corrections: If you must test multiple relationships, consider adjusting your significance thresholds. Testing 20 relationships? Your threshold should be 0.05/20 = 0.0025 (using the Bonferroni correction).
Watch for red flags:
Testing hundreds of variables without clear theory
Cherry-picked time periods ("worked perfectly from 2015-2018")
Vague answers to "How many relationships did you test?"
Results that defy logical explanation
Demand evidence
The grandma test: If you can't explain why the relationship makes logical sense to your grandmother, be very suspicious.
Insist on replication: Real relationships should hold up when tested on fresh data from different time periods or populations. If your "discovery" can't be replicated, it's probably noise.
Embrace boring hypotheses: The most reliable discoveries often come from testing obvious, theoretically motivated relationships rather than hunting for surprising patterns.
The Tyler Vigen Hall of Fame
Tyler Vigen's website is a masterclass in how correlation mining produces absurd results. These correlations are all real, statistically significant, and completely meaningless:
The spelling bee spider death connection: The number of letters in the Scripps National Spelling Bee winning word correlates with the number of people killed by venomous spiders
The Nicolas Cage drowning predictor: Films Nicolas Cage appeared in per year correlates with people who drowned by falling into a pool
The Rick Roll economic indicator1: The popularity of the "Never Gonna Give You Up" meme correlates with the number of market research analysts in Wyoming
The Thomas crime wave: The popularity of the first name "Thomas" correlates with motor vehicle thefts in Maine

Vigen created these examples by doing exactly what data snoopers do: systematically testing thousands of variable combinations until statistically significant patterns emerged. The fact that he could generate an endless stream of "significant" but meaningless correlations proves the point perfectly.
In fact, Tyler recently took this work one step further and started creating AI-generated papers to support the spurious correlations.

The modern data snooping explosion
Data snooping has become exponentially more dangerous in the age of big data and machine learning:
Massive datasets: With millions of data points and thousands of variables, the potential for spurious discoveries is enormous.
One-click auto-testing: Modern software can run thousands of statistical tests in minutes, making it trivially easy to mine for significance. Machine learning algorithms can automatically test millions of feature combinations, practically guaranteeing they'll find "significant" patterns in noise.
The replication crisis: Many "groundbreaking" research findings fail to replicate when tested independently, often due to unacknowledged data snooping. I have a lot more to share here, but perhaps in a later piece!
Death by a thousand tests
Data snooping exploits our natural desire to find patterns and meaning in data. It feels productive, scientific, and thorough. But it's often just a sophisticated way of fooling yourself.
The more relationships you test without proper controls, the more likely you are to find impressive-looking nonsense.
Remember the entertainment fund manager betting on Zimbabwean Mac sales. That correlation was real, statistically significant, and completely useless for making investment decisions.
Before you act on any "discovered" relationship:
Ask how many other relationships were tested
Demand validation on fresh data
Insist on a plausible causal mechanism
The goal isn't to stop exploring data — it's to explore it responsibly.
This is Part 4 of our 9-part series on statistical fallacies. Subscribe below for more:
Next time: We'll tackle a subtler but equally dangerous trap: base rate neglect. I'll show you why a 90% accurate medical test might mean you only have a 15% chance of actually being sick, and how ignoring baseline probabilities leads to spectacularly wrong conclusions.
Catch up on the entire series: